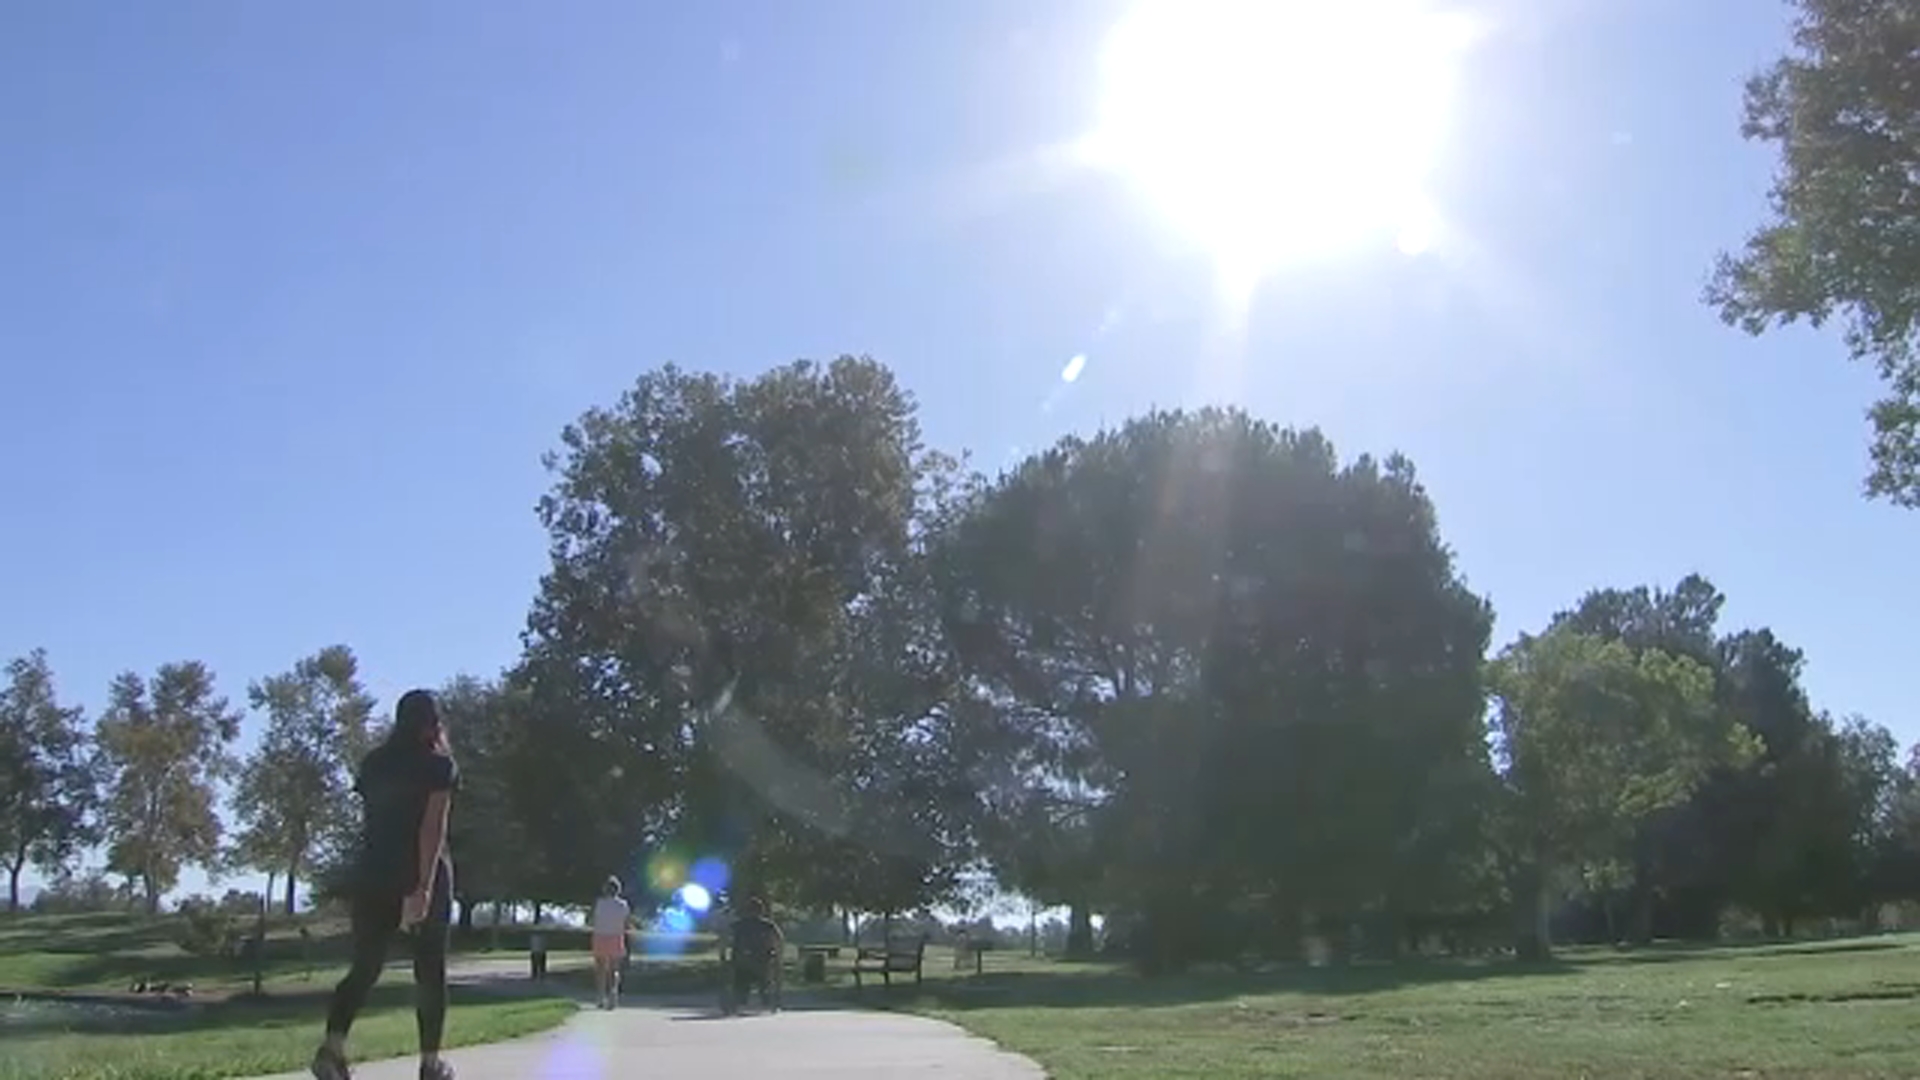
Chicago heat data will help address urban heat islands; July on track to be hottest month on record

CHICAGO (WLS) -- July is on track to be the hottest month ever recorded in human history. As part of a nationwide effort, volunteers in Chicago were in every neighborhood to collect heat data to help solve the problem of potentially deadly urban heat islands.
Volunteers connected specialized equipment that is GPS enabled to their cars and drove through each neighborhood, sending data to satellites measuring the actual feel of the temperature on the ground in an effort to show where resources are most needed for heat resiliency to save lives as temperatures rise.
"This program is about finally visualizing disparities," said CDPH Director of Environmental Innovation Raed Mansour.
Mansour said the city and NOAA are partnering to record a ground level heat map, neighborhood by neighborhood, That will allow the city to prioritize and allocate resources based on recorded vulnerabilities.
The areas most in need of heat resilience, in many cases, are predominantly neighborhoods of color on the South and West Sides.
"Neighborhoods through the South, Southwest and West Sides not only suffer for more heat because we have less trees, more heat islands. We are closer to the freeways, we're close to warehouses, factories, railyards," said Dr. Howard Ehrman, co-founder of the People's Response Network.
Ehrman, one of the hub coordinators for Friday's heat watch, said he was there for the disastrous 1995 heat wave that claimed more than 700 lives in Chicago.
"Right now as a physician who was at 1995 in front of Cook County Hospital System literally crying with other physicians, watching 739 people die in four days, the city is no more prepared now than it was then," he said.
Ehrman said collecting precise temperature, wind speed, humidity and location data with the NASA and NOAA satellite connects devices is vital to identify cooling solutions. More than 500 volunteers took part, saying they want to take control of the climate future in their neighborhood.
NOAA will publish this data and the city will create a risk assessment map neighborhood by neighborhood to show who's most at risk.


